Datadog Webhook
Receive Datadog monitor alert notifications directly into NudgeBee. When a monitor triggers, NudgeBee automatically creates an event enriched with related logs, traces, and metric details from your Datadog account.
Step 1: Create the Webhook in NudgeBee
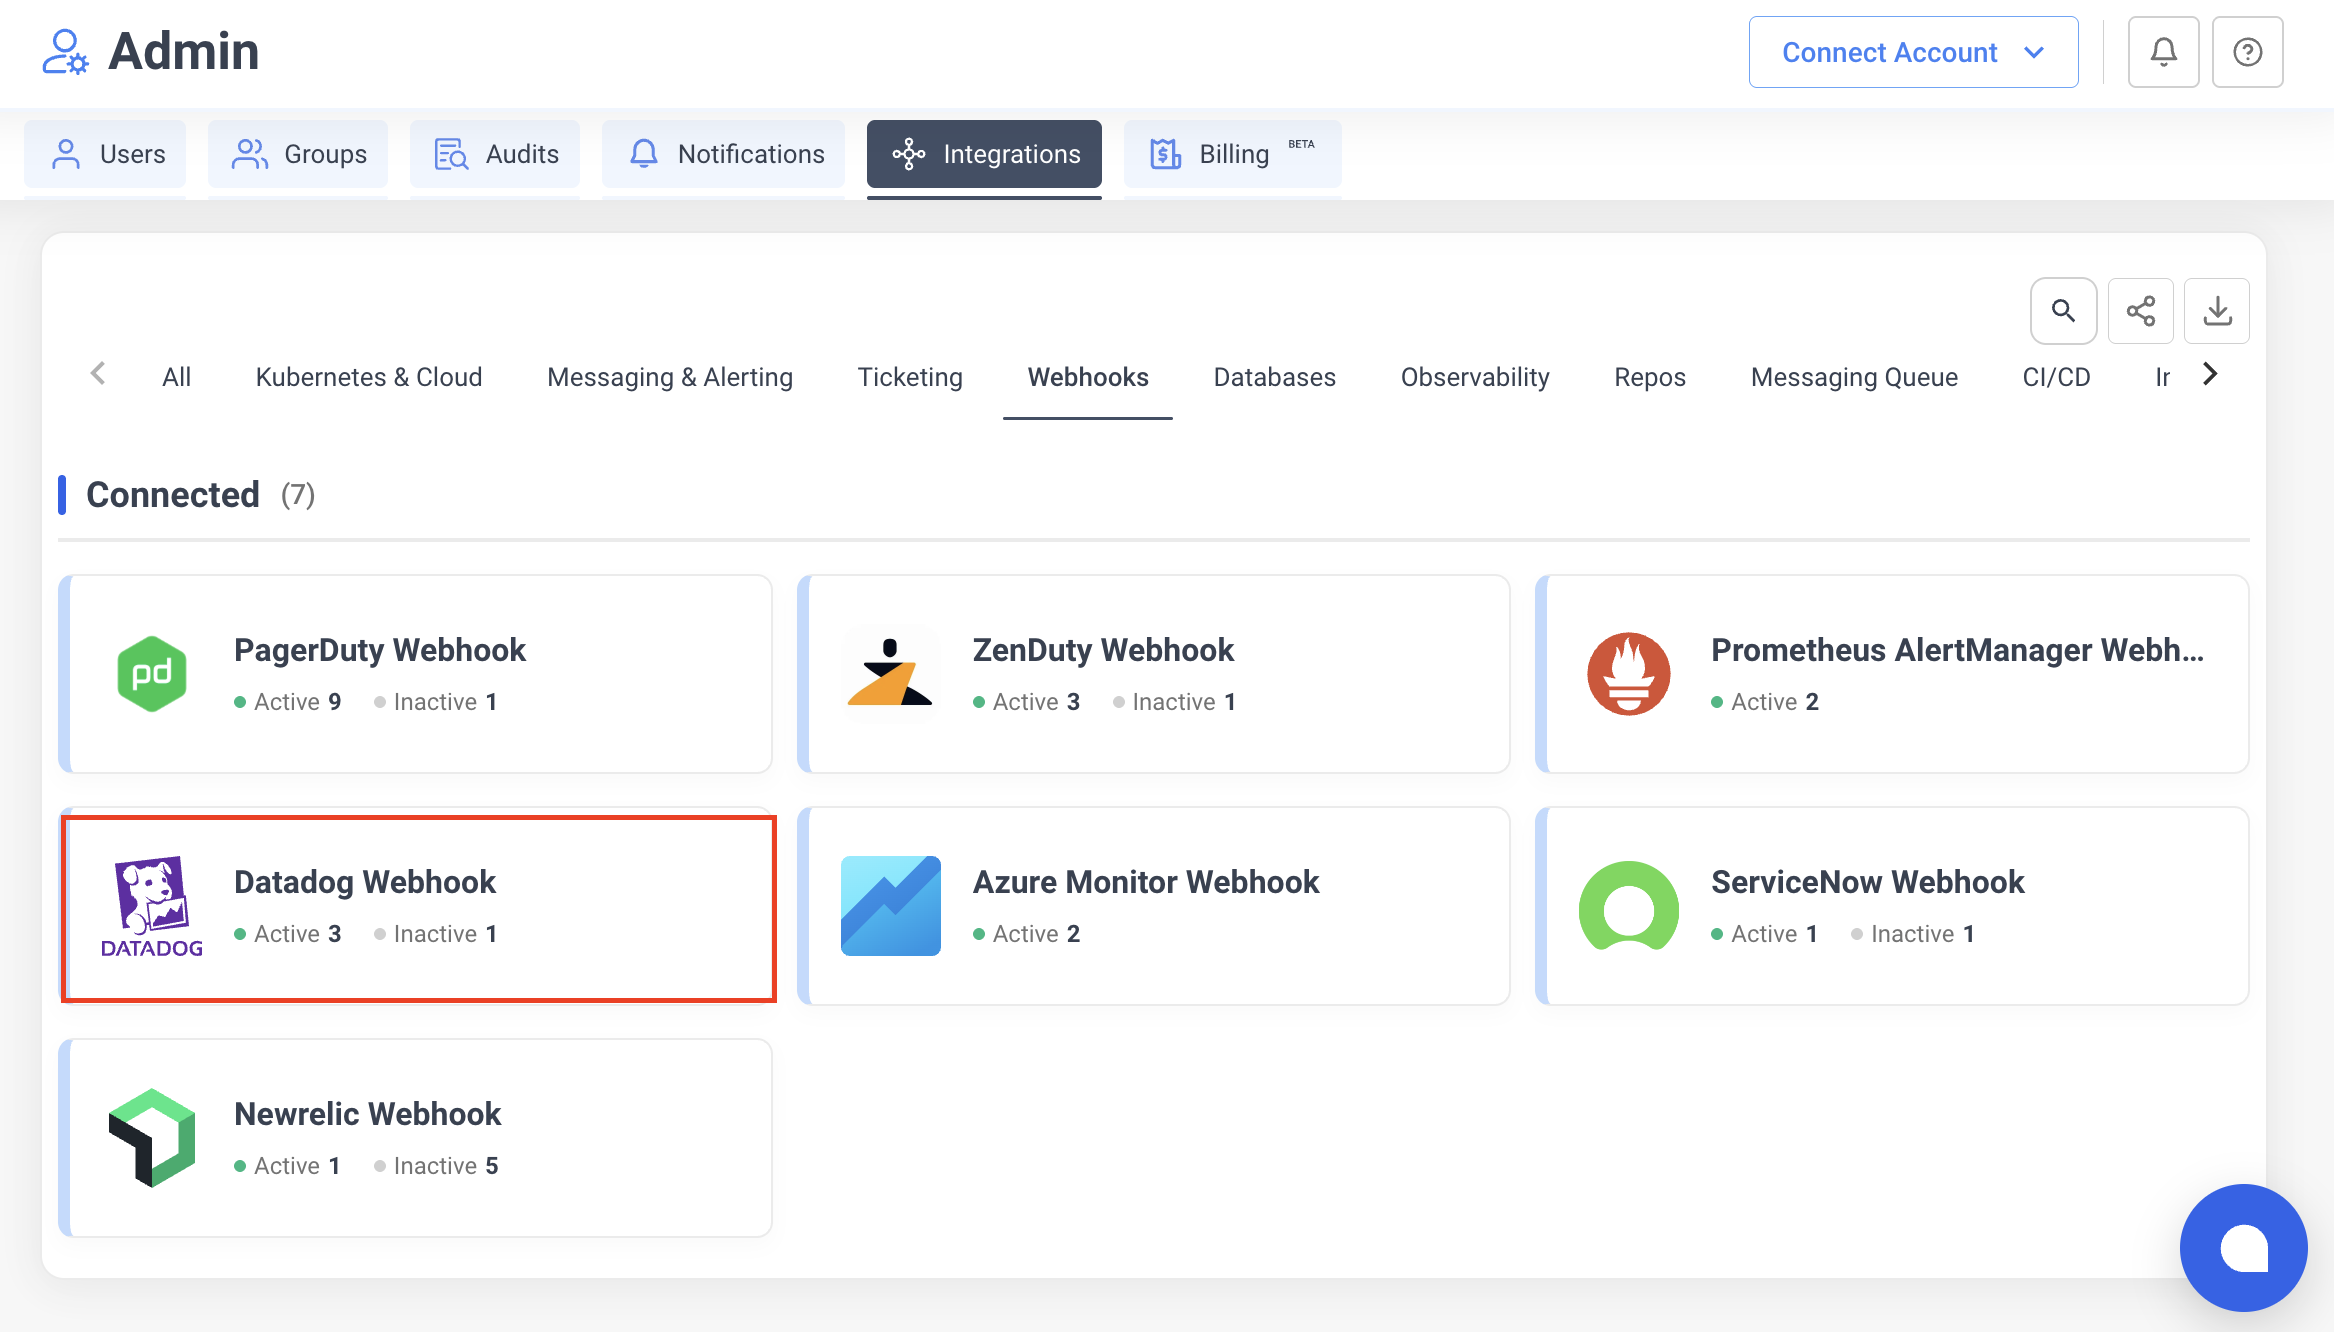
- Navigate to Integrations > Webhooks tab.
- Click the Datadog Webhook card.
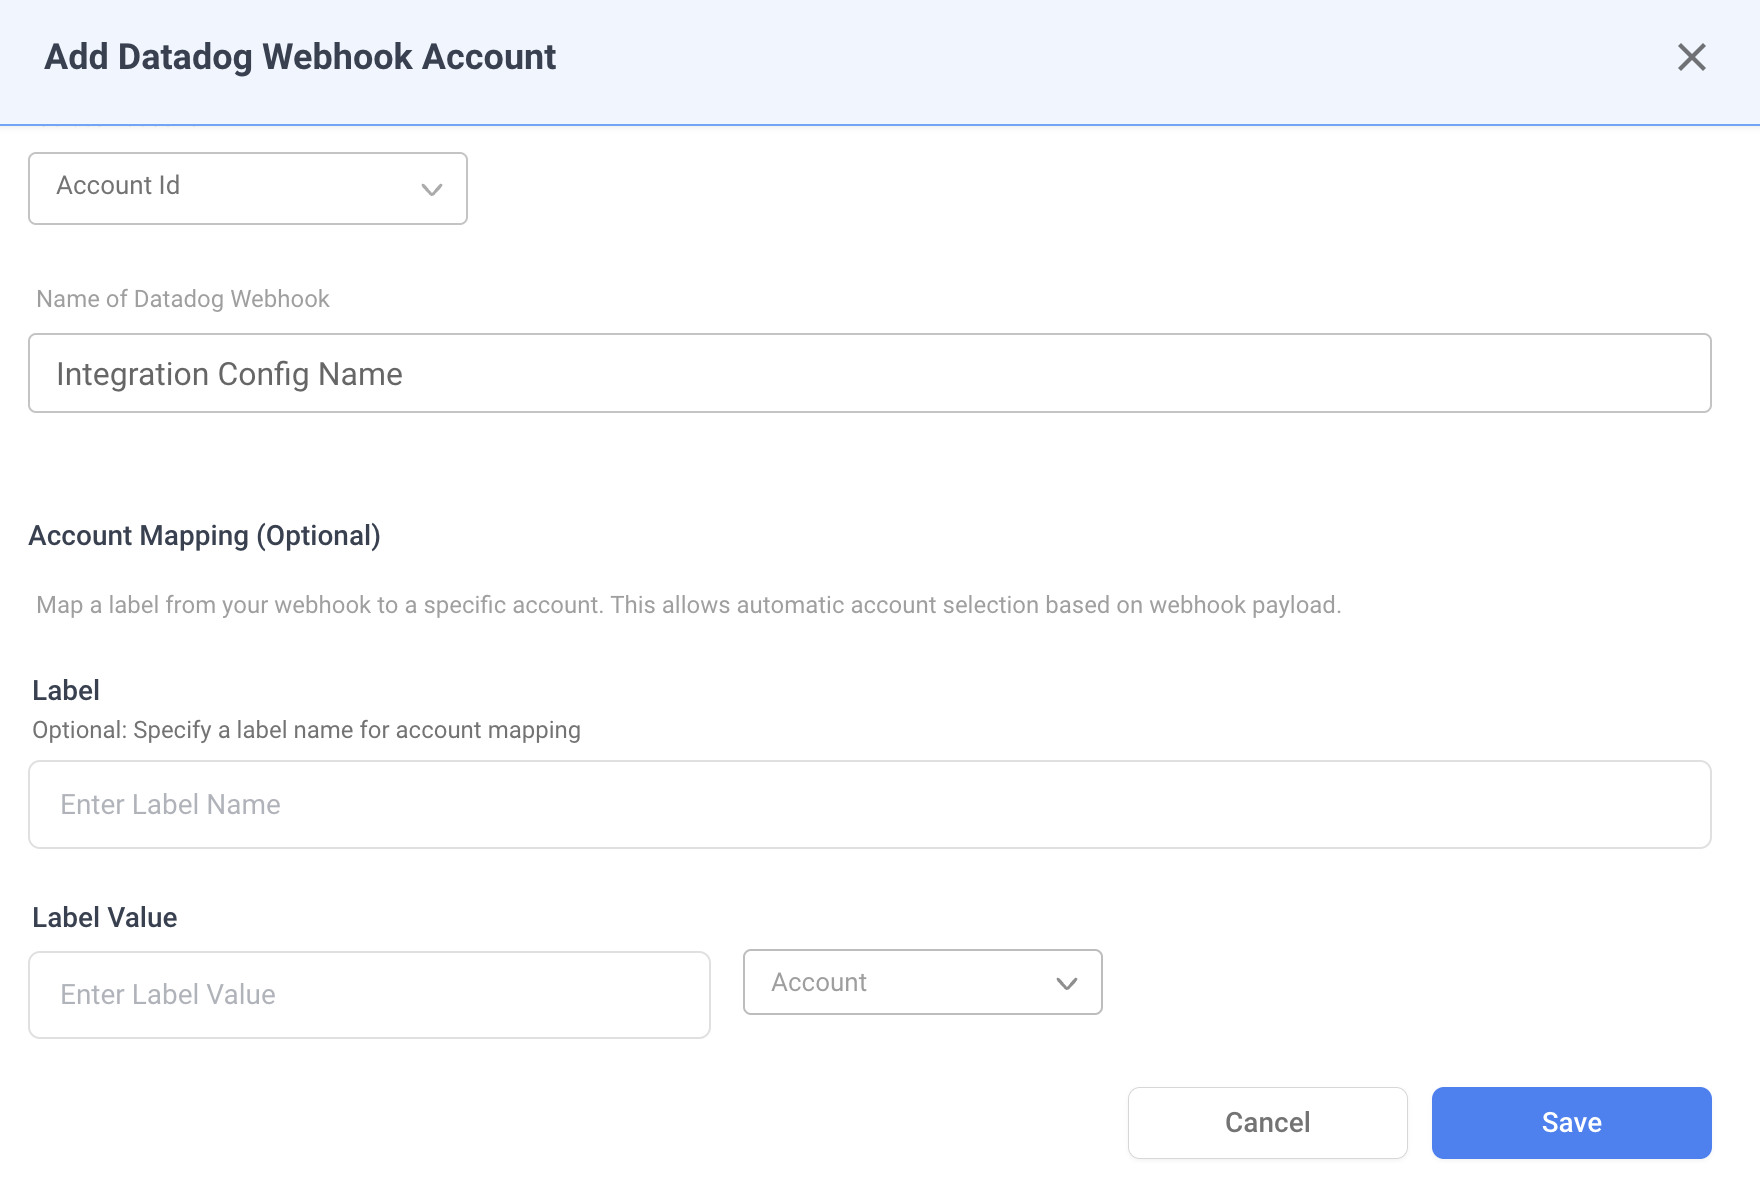
- Fill in the configuration:
- Integration Config Name — a descriptive name (e.g.,
Production Alerts). - Account — select the NudgeBee account to receive events.
- Integration Config Name — a descriptive name (e.g.,
-
Click Save. NudgeBee generates a unique webhook URL.
-
Copy the webhook URL from the dialog. It follows this format:
https://<your-nudgebee-domain>/api/webhooks/datadog?token=<generated-token>
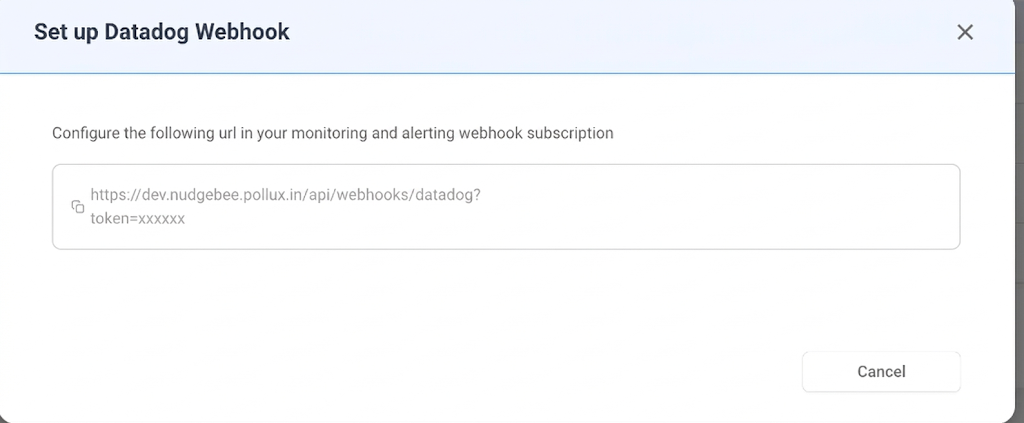
Keep this URL — you will paste it into Datadog in the next step.
Step 2: Configure Datadog Webhook Integration
-
In Datadog, go to Integrations and search for Webhooks.
-
Click on the Webhooks integration tile and then click New.
-
Configure the webhook:
- Name: enter a descriptive name (e.g.,
nudgebee). - URL: paste the NudgeBee webhook URL from Step 1.
- Custom Headers: none required (authentication is handled via the
tokenquery parameter).
- Name: enter a descriptive name (e.g.,
-
Set the Payload to the following JSON:
{
    "id": "$ID",
    "last_updated": "$LAST_UPDATED",
    "event_type": "$EVENT_TYPE",
    "title": "$EVENT_TITLE",
    "date": "$DATE",
    "org": {
        "id": "$ORG_ID",
        "name": "$ORG_NAME"
    },
    "body": "$EVENT_MSG",
    "alert": {
        "alert_id": "$ALERT_ID",
        "alert_metric": "$ALERT_METRIC",
        "alert_query": "$ALERT_QUERY",
        "alert_status": "$ALERT_STATUS",
        "alert_scope": "$ALERT_SCOPE",
        "alert_transition": "$ALERT_TRANSITION",
        "alert_type": "$ALERT_TYPE",
        "alert_metric_namespace": "$METRIC_NAMESPACE"
    },
    "incident": {
        "incident_public_id": "$INCIDENT_PUBLIC_ID",
        "incident_severity": "$INCIDENT_SEVERITY",
        "incident_status": "$INCIDENT_STATUS",
        "incident_url": "$INCIDENT_URL",
        "incident_uuid": "$INCIDENT_UUID",
        "incident_message": "$INCIDENT_MSG",
        "incident_title": "$INCIDENT_TITLE",
        "incident_slack_channel_id": "#inc-$INCIDENT_PUBLIC_ID-$INCIDENT_TITLE",
        "incident_integrations": $INCIDENT_INTEGRATIONS,
        "incident_fields": $INCIDENT_FIELDS
    },
    "event": {
        "aggreg_key": "$AGGREG_KEY",
        "event_id": "ID",
        "event_url": "$LINK"
    }
}
- Click Save to create the webhook.
Step 3: Add the Webhook to a Monitor
- In Datadog, go to Monitors > Manage Monitors.
- Create a new monitor or edit an existing one.
- In the Notify your team section, add the webhook by typing
@webhook-<name>(e.g.,@webhook-nudgebee). - Save the monitor.
For more details on Datadog webhook integrations, see Datadog's documentation.
How It Works
When Datadog sends a webhook payload to NudgeBee, the following processing occurs:
State Mapping
| Datadog Alert Transition | NudgeBee Status |
|---|---|
Triggered, Re-Triggered | Firing |
Warn | Firing |
Recovered | Resolved |
No Data | Firing |
Priority Mapping
| Datadog Priority | NudgeBee Priority |
|---|---|
P1, P2 | High |
P3 | Medium |
P4, P5 | Low |
Automatic Evidence Collection
If a Datadog observability integration is also configured for the same account, NudgeBee automatically enriches each alert event with:
- Related Logs — fetched from Datadog for the impacted host or service, covering a 30-minute window before and after the alert trigger time.
- Related Traces — APM traces for the impacted service in the same time window.
- Metric Details — metric data related to the alert query, including:
- For APM services: error rate, latency, and request throughput.
- For infrastructure hosts: CPU, memory, and disk utilization.
Event Deduplication
Events are deduplicated using a fingerprint derived from the monitor ID and aggregation key (<monitorId>-<aggregKey>). Repeated webhook calls for the same alert update the existing event instead of creating duplicates.
Verify the Integration
- In Datadog, trigger a test alert (or use Test Notifications from the monitor edit page).
- Confirm the monitor is configured with the
@webhook-nudgebeenotification. - In NudgeBee, navigate to Events and verify the alert appears with:
- Correct title and priority
- Alert details evidence attached
- Related logs and traces (if observability integration is configured)
Troubleshooting
| Issue | Resolution |
|---|---|
| Webhook URL returns 401 | Verify the token query parameter in the URL is correct. Regenerate the integration if needed. |
| Events created but no logs/traces attached | Ensure a Datadog observability integration is configured for the same NudgeBee account. |
| Events not appearing at all | Check that the Datadog monitor includes @webhook-<name> in its notification settings and that the webhook integration is active. |
| Duplicate events | Expected behavior — NudgeBee deduplicates by monitorId-aggregKey. State updates (e.g., Triggered → Recovered) update the existing event. |